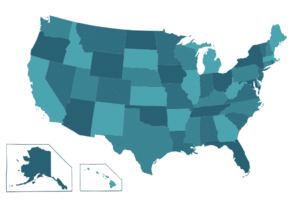
State-by-State Caseload Ceilings
By: Shane Reed, M.S., CCC-SLP
Published: 4/17/2024
The demand for speech-language pathologists is ever-growing due to increased need for support from populations across lifespan and a scope that continues to expand; however, there has been an observable shortage. Due to the increased need and a reduced ability to fill roles, the caseloads and workloads of SLPs continue to rise. Graduate programs across the nation must continue to develop their programs to admit more students desiring to pursue this field to combat the ongoing shortage. Also, it is ideal for us as professionals to take into consideration the realistic expectations we can carry and complete. After all, “This scarcity of SLPS is a nationwide concern because most SLPs are employed in school settings, and when schools cannot employ enough qualified individuals, the students’ needs either go unmet, or students are served by untrained persons” (Squires, 2013).
Below is a list of the designated caseload caps of all fifty states within the USA and the District of Columbia. Some states have not established ceilings for caseloads; therefore, “no minimum or maximum” is indicated. This information was gathered from ASHA’s published 2022 State-by-State Caseload Guidance. Additionally, data for states’ average caseloads is included if published within ASHA’s 2022 Schools Survey.
- Alabama
-
- Maximum of 30 students
- Alaska
-
- No minimum or maximum
- Arizona
-
- No minimum or maximum
- Caseload average of 57 students
- Arkansas
-
- Maximum of 45 students
- Caseload average of 40 students
- California
-
- School-age is 55 students & Preschool is 40 students
- Caseload average of 55 students
- Colorado
-
- No minimum or maximum
- Caseload average of 45 students
- Connecticut
-
- No minimum or maximum
- Caseload average of 33 students
- Delaware
-
- No minimum or maximum
- District of Columbia
-
- No minimum or maximum
- Florida
-
- No minimum or maximum
- Caseload average of 60 students
- Georgia
-
- Maximum of 55 students
- Caseload average of 45 students
- Hawaii
-
- No minimum or maximum
- Idaho
-
- No minimum or maximum
- Illinois
-
- Compared to workload, but after analysis, no more than 60
- Caseload average of 42 students
- Indiana
-
- Caseloads are limited to allow implementation of IEPs
- Caseload average of 72 students
- Iowa
-
- No minimum or maximum
- Kansas
-
- No minimum or maximum
- Caseload average of 45 students
- Kentucky
-
- Maximum of 65 students
- Caseload average of 53 students
- Louisiana
-
- Maximum of 79 points. Points are given for each hour of assessment, consultation, supervision, as well as every student
- Caseload average of 55 students
- Maine
-
- Maximum of 50 students
- Maryland
-
- No minimum or maximum
- Caseload average of 43 students
- Massachusetts
-
- No minimum or maximum
- Caseload average of 38 students
- Michigan
-
- Maximum of 60 students
- Caseload average of 53 students
- Minnesota
-
- No minimum or maximum
- Caseload average of 47 students
- Mississippi
-
- Maximum of 48 students
- Missouri
-
- No minimum or maximum
- Caseload average of 44 students
- Montana
-
- No minimum or maximum
- Nebraska
-
- No minimum or maximum
- Nevada
-
- Maximum caseload of 50 +/- 10%
- New Hampshire
-
- No minimum or maximum
- New Jersey
-
- No minimum or maximum
- Caseload average of 40 students
- New Mexico
-
- Maximum of 60 SLP only students
- New York
-
- Maximum of 65 students
- Caseload average of 30 students
- North Carolina
-
- Maximum of 50 students
- Caseload average of 49 students
- North Dakota
-
- No minimum or maximum
- Ohio
-
- Should not exceed 80 students
- Caseload average of 58 students
- Oklahoma
-
- Using a formula created by the state, no more than 50 students
- Caseload average of 50 students
- Oregon
-
- No minimum or maximum
- Caseload average of 50 students
- Pennsylvania
-
- Maximum of 65 students
- Caseload average of 49 students
- Rhode Island
-
- No minimum or maximum
- South Carolina
-
- Maximum of 60 students
- Caseload average of 50 students
- South Dakota
-
- No minimum or maximum
- Tennessee
-
- No minimum or maximum
- Caseload average of 60 students
- Texas
-
- No minimum or maximum
- Caseload average of 60 students
- Utah
-
- No minimum or maximum
- Vermont
-
- No minimum or maximum
- Virginia
-
- Maximum of 68 students
- Caseload average of 50 students
- Washington
-
- No minimum or maximum
- Caseload average of 46 students
- West Virginia
-
- Maximum of 50 students
- Wisconsin
-
- No minimum or maximum
- Caseload average of 40 students
- Wyoming
-
- No minimum or maximum
References:
2022 State-by-State Caseload Guidance. (n.d.). https://www.asha.org/siteassets/practice-portal/caseloadworkload/state-caseload-chart.pdf
ASHA 2022 Schools Survey: SLP Caseload and Workload Characteristics Report. (2022, August 16). https://www.asha.org/siteassets/surveys/2022-schools-survey-slp-caseload.pdf
Squires, K. (2013, Winter). Addressing the Shortage of Speech-Language Pathologists in School Settings. https://files.eric.ed.gov/fulltext/EJ1135588.pdf


